An Example of using the PEWMA model for data analysis
In Brandt and Williams (1999)
we present an application of the basic PEWMA model. This model is
a state-space model
that is estimated using the Kalman filter. The basic model can be
written in two equations: an observation or measurement
equation and a state or stochatic equation. The basic model is
Pr(yt |mt) = mtyt exp(mt) / yt !
where
mt = mt-1exp(rt)nt.
This model can be used to describe persistent, or long memoried event counts series. For details see Brandt et al. 2000.
An emerging area of scholarship on the Supreme Court looks at
the nature of agenda change over time. Changes in the Court's
agenda may result from new membership, landmark decisions,
leadership changes, and a new role for the institution. Of great
interest is the nature of the dynamic process that accompanies
agenda change.
Pacelle (1991) and Pacelle et al. (1998) argue that significant
agenda change occurred in two main areas of the Court's agenda
since the 1950s. First, there was a significant increase in the
number of cases concerning issues of Equality and the 14th
Amendment (e.g. race, gender, age, disability). Second, there was
a decrease in the number of cases involving Regulation (e.g. the
regulation of business by the federal government). These changes
in agenda composition and dynamics resulted from three major
changes in the Court. The first was the shift to civil rights and
civil liberties issues in the wake of the civil rights movement
and the Court's decision to abandon efforts to interfere in
regulatory policy after Justice Harlan Stone's famous Footnote
Four in U.S. v. Carolene Products. More significantly in
1953, the appointment of Earl Warren as Chief Justice altered the
leadership of the Court. Warren's leadership is viewed as a
significant change from that of his predecessor Fred Vinson.
Finally, the Court delivered the landmark decision in Brown
v. Board of Education during the 1953 term.
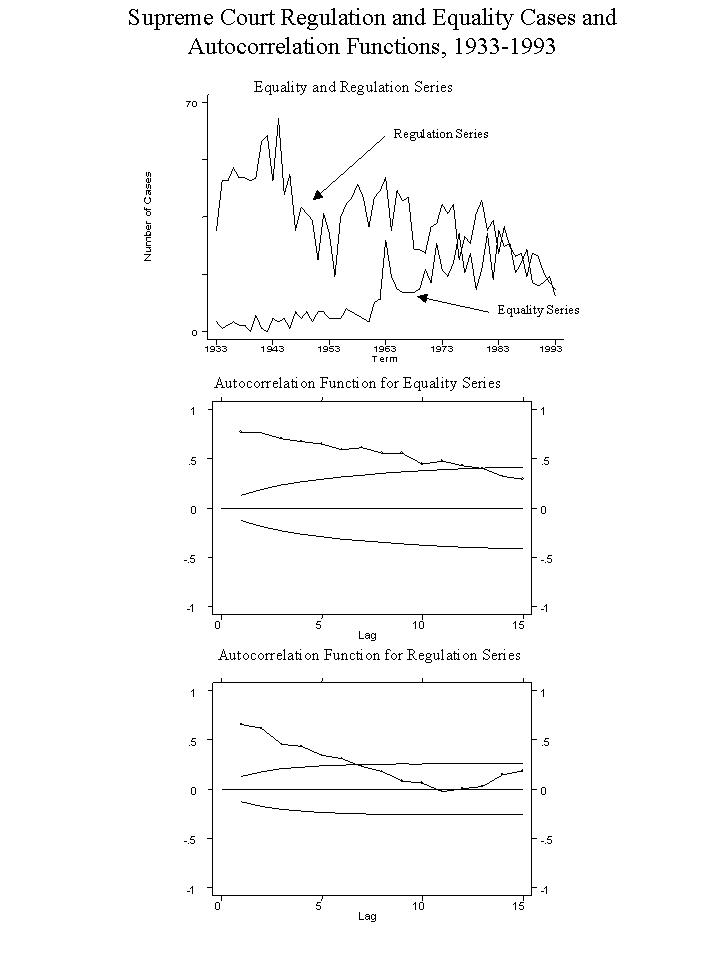
In our replication, we utilize the number of cases in the
Equality and Regulation agenda areas to which the U.S. was a
party from 1933 to 1993. Using the counts of the number of cases
is preferred because the percentages are influenced by the number
of cases that the Court accepts in all areas. The more cases the
Court accepts in other areas, the less certain we can be of the
changes, since they will affect the denominator in the
calculation of the proportion. Thus the actual counts of the
cases in each area present a better measure of the agenda.
Based on this data, we are interested in determining the changes
in the Court's agenda after the 1953 term. Our expectation is
that in the post-1953 period, we should see a rise in the number
of cases dealing with issues of Equality (racial, gender, etc.)
and a decline in the number of cases dealing with economic
Regulation. For our analysis we perform an intervention analysis
of the number of cases in the economic Regulation and Equality
agendas before and after 1953.
Each of these series exhibits a strong degree of temporal
dependence, as seen by looking at the data and its ACFs:
Based on these persistent ACF's, we estimated a
series of intervention models (again, for details, see Brandt and
Williams 1998).
Of interest is whether the decline begins in 1953 for the
Regulation cases and whether the rise in Equality cases begins
immediately after Brown or whether there was a lag. Of
additional interest is the year in which the lag intervention
occurred. The temporary intervention is used because we believe
its effect raises the number of cases in the Equality series
(decreases the number of cases in the Regulation series). Such
temporary effects, however, should have a permanent effect on the
level of the series (see Harvey 1991: 397-99). Since we are not
sure of the lag specification for the intervention (i.e. how long
after Brown the increase/decrease in cases occurred), we
empirically determined the intervention specifications from a one
period to an 10 period forward lag (1954-1963). The optimal
intervention specification will maximize the log-likelihood of
the model.
Using the PEWMA, the lag specification with the highest
likelihood value for the series was 10 lags for the Equality
series (1963) and one lag for the Regulation series (1954). These
are consistent with the VAR results reported in Pacelle et al.
(1998). The coefficient in the PEWMA model for the intervention
was 0.9024 for the Equality series and -0.7165 for the economic
Regulation series. In the Regulation case the intervention has a
negative effect as predicted and a large absolute t-ratio greater
than three. For the equality series, a similar conclusion holds.
PEWMA estimates for equality series
with interventions
| Year | Omega | I(t) | Log-Likelihood | AIC |
| 1953 | 0.568 | -0.231 | -168.07 | 338.14 |
| 1954 | 0.570 | -0.234 | -168.00 | 338.00 |
| 1955 | 0.570 | -0.303 | -168.00 | 338.00 |
| 1956 | 0.564 | 0.302 | -167.95 | 337.89 |
| 1957 | 0.566 | 0.057 | -168.15 | 338.30 |
| 1958 | 0.573 | -0.204 | -168.07 | 338.14 |
| 1959 | 0.586 | -0.556 | -167.58 | 337.16 |
| 1960 | 0.594 | -1.053 | -166.16 | 334.32 |
| 1961 | 0.568 | -0.113 | -168.11 | 338.22 |
| 1962 | 0.559 | -0.281 | -167.83 | 337.65 |
| 1963 | 0.628 | 0.902 | -162.14 | 326.28 |
| 1964 | 0.575 | 0.160 | -168.01 | 338.03 |
PEWMA estimates for economic regulation
series with interventions
| Year | Omega | I(t) | Log-Likelihood | AIC |
| 1953 | 0.581 | -0.033 | -205.93 | 413.86 |
| 1954 | 0.608 | -0.717 | -201.55 | 405.09 |
| 1955 | 0.578 | 0.060 | -205.89 | 413.79 |
| 1956 | 0.580 | 0.100 | -205.81 | 413.62 |
| 1957 | 0.582 | 0.090 | -205.82 | 413.65 |
| 1958 | 0.585 | 0.176 | -205.47 | 413.93 |
Using the AIC criteria, we chose the model with a 10 period lead for the equality series, and a one period lead for the economic regulation series. It therefore appears that the change in the Supreme Court case agenda for civil rights was delayed, while the change in the regulation case agenda was rather proximate to the 1953 Supreme Court term.